 Australia
 Factsheet
Did you know ?
Multiples charts provide an effective way to quickly analyze a company's valuation over a period of time, and compare it against the valuation of another company, a personal list, or a market index.
Breville Group Limited (Formerly Housewares International) |
| Sector: Durable Household Products | Ticker: BRG | ISIN: AU000000BRG2 |
|
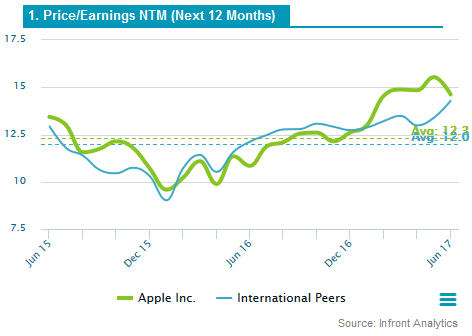
The most common multiple used in the valuation of stocks is the P/Earnings NTM multiple (Price to Earnings). P/E relates the current share price with the market expectations in terms of Earnings Per Share. This multiple is used to compare a company's market value with its earnings. A company with a high P/Earnings NTM is considered to be overvalued; a company with a low P/Earnings NTM is considered to be undervalued.
The P/Earnings NTM ratio of Breville Group Limited is significantly higher than the median of its peer group: around 12.00. The company valuation of Breville Group Limited according to these metrics is way above the market valuation of its peer group.
The P/Earnings NTM ratio of Breville Group Limited is significantly higher than the average of its sector (Durable Household Products): 13.72. The company valuation of Breville Group Limited according to these metrics is way above the market valuation of its sector.
The P/Earnings NTM ratio of Breville Group Limited is lower than its historical 5-year average: 31.2. The (current) company valuation of Breville Group Limited is therefore below its valuation average over the last five years.
|
|
| ||||||||||||||||||||||||||||||||||||||||||||||||||||||||||||||||||||||||||||||||||||||||||||||||
| ||||||||||||||||||||||||||||||||||||||||||||||||||||||||||||||||||||||||||||||||||||||||||||||||||
Many methods can be used to value a company. In reality, business valuation is often a combination of these different approaches. One of the most widely used quantitative methods is the market multiples method. The market valuation is utilized generally as a primary market input, to provide an objective starting point for the valuation. Put simply, this method multiplies the sales or profits of a business by an industry averaged multiplier to calculate the Market Value of the business.
Current multiples include:
- Historical multiples based on standardized financials for the last completed fiscal period: Last, Last Twelve Months (LTM);
- Forward multiples based on consensus estimates for the current fiscal period and next ones: Next Twelve Months (NTM), FY0, FY1.
Current multiples based on per-share metrics (such as earnings per share or book value per share) are calculated using the last closing price, while current multiples based on company-level metrics (such as net sales, EBIT or EBITDA) are calculated using the current market cap or EV (Enterprise Value).